

代码拉取完成,页面将自动刷新
Inspection equipment for the semiconductor industry saves companies millions of dollars. This project uses the MIR-WM811K Corpus» of wafer maps to build a CNN classifier to automate classification of wafer defect patterns.
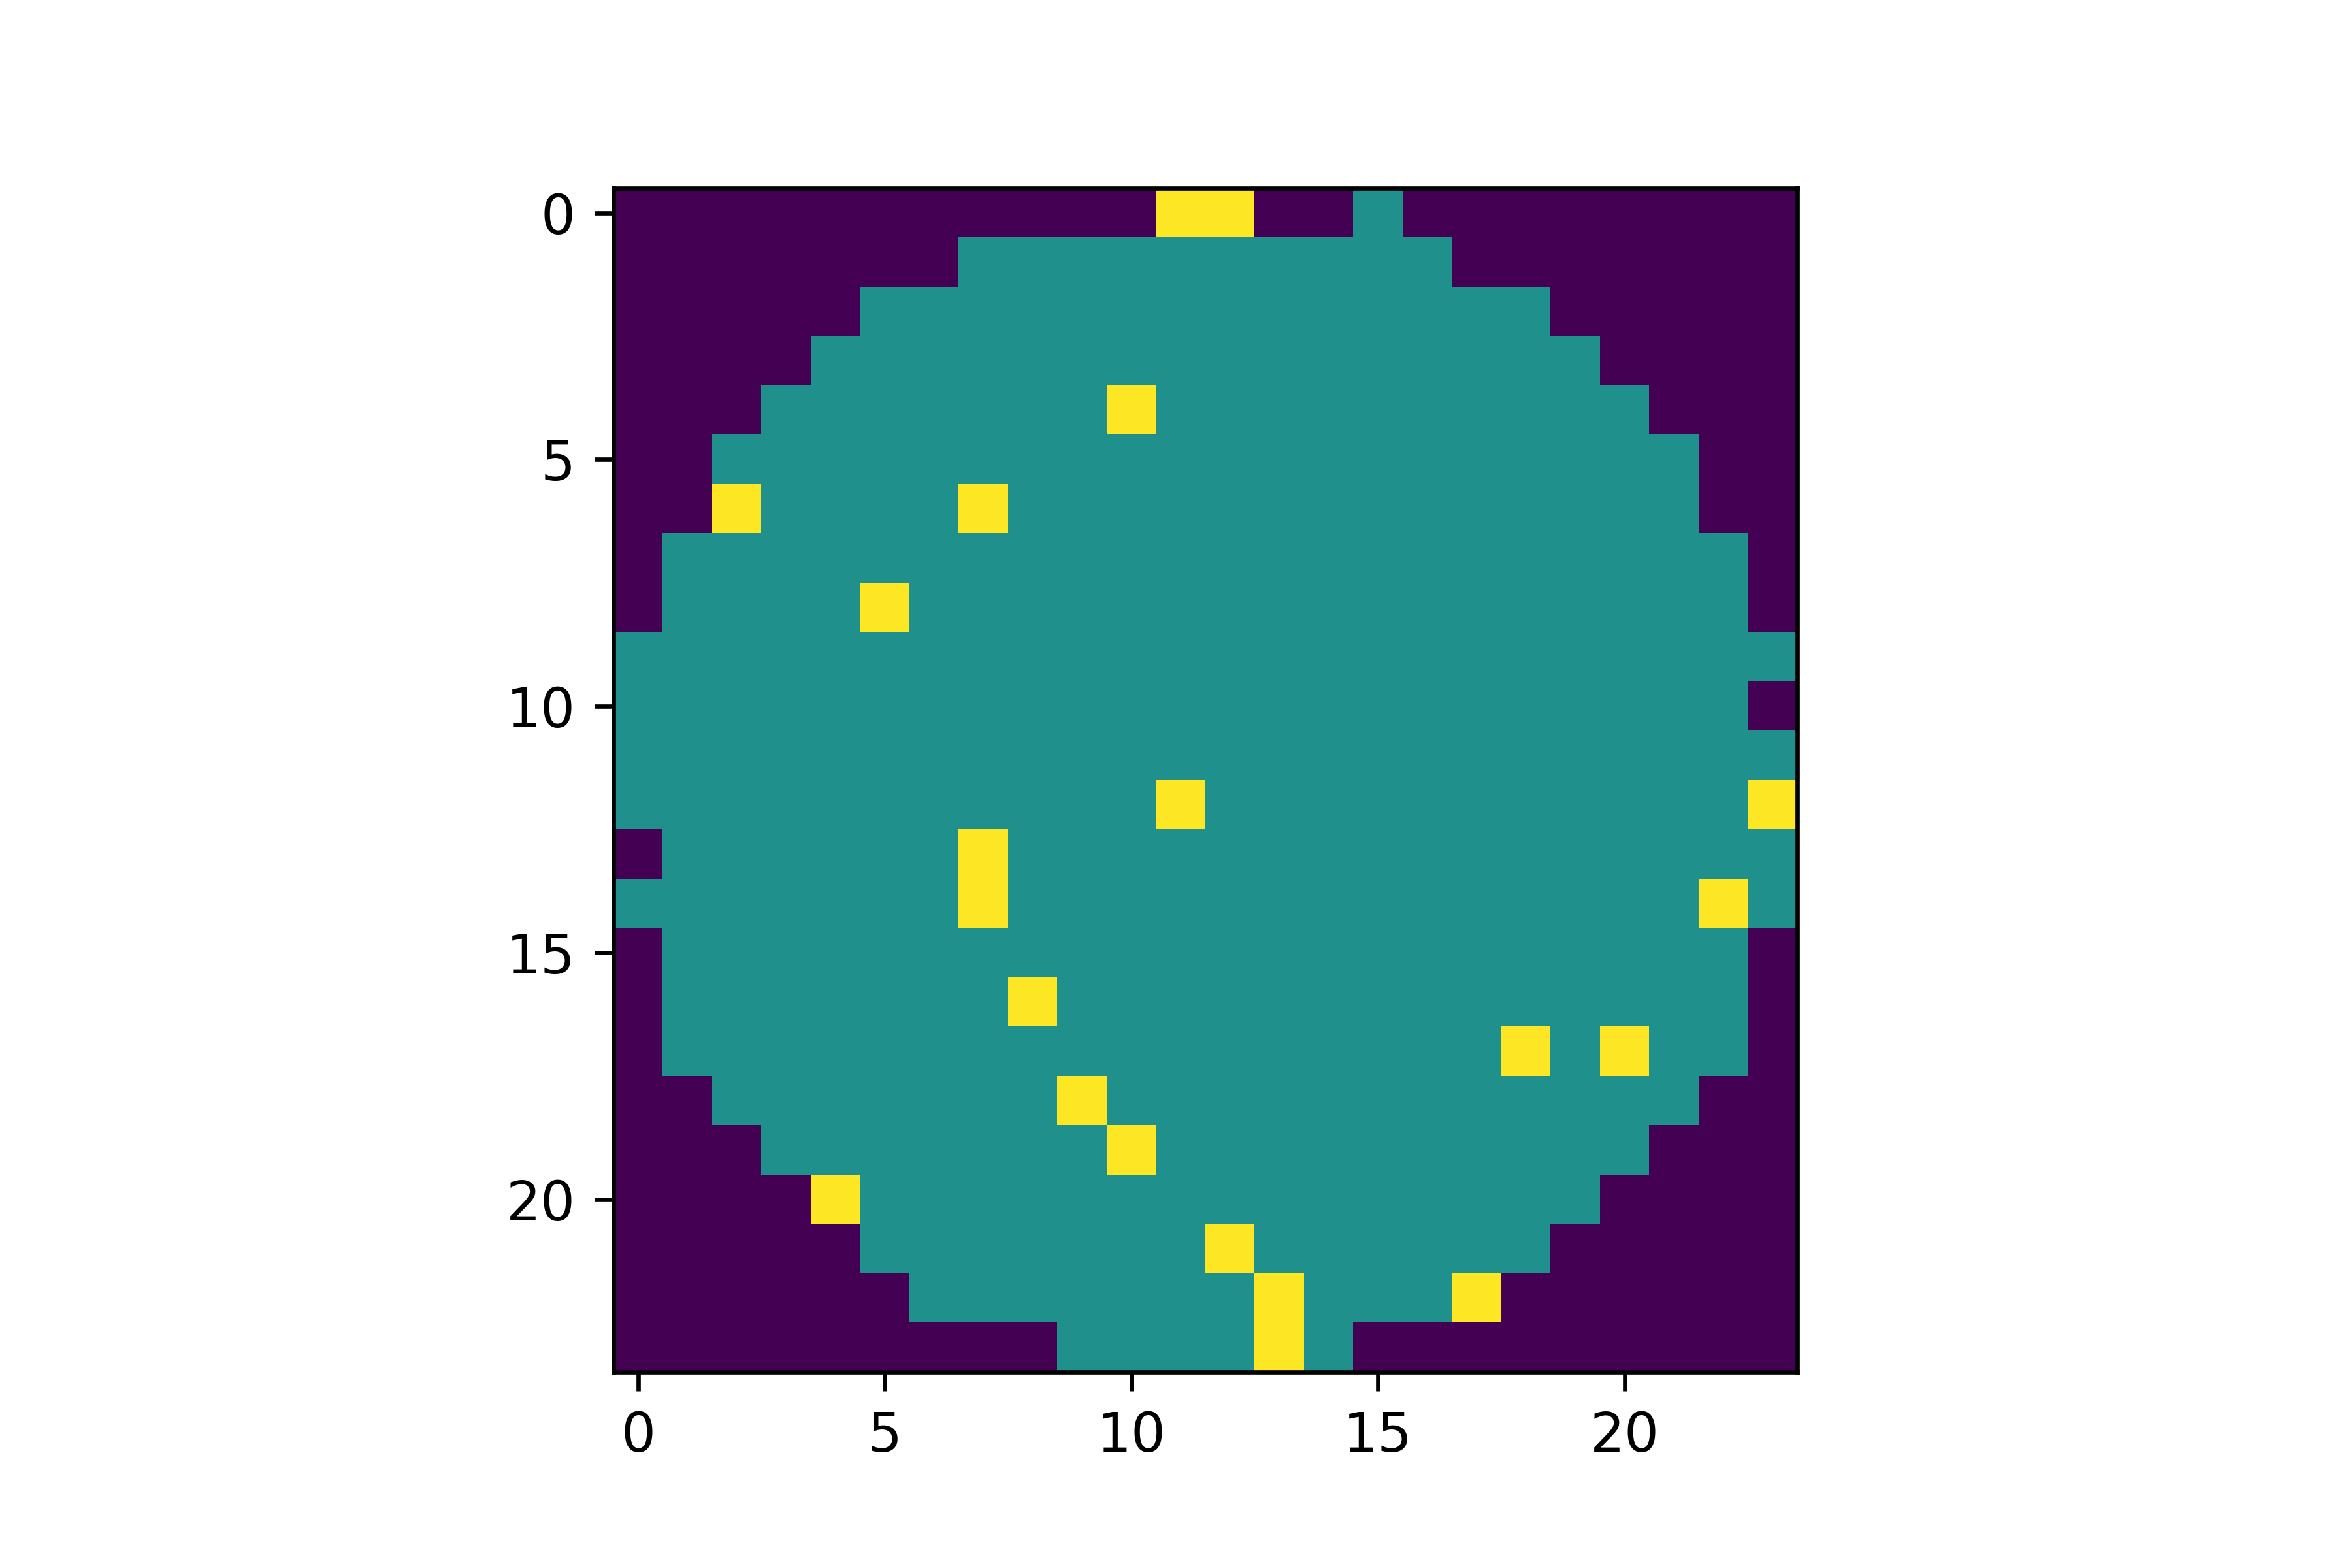
Many readers may be wondering, what is a wafer map? First, wafers are thin slices of semiconductor material (usually silicon) which serve as a substrate to fabricate microchips ("chips"/"dies") or solar cells. Wafers are circular, per the manufacturing process, and chips are rectangular. A complete wafer with arrays of chips is tested electrically, to find which chips are functional versus faulty. An image can be constructed from these results to show the locations of each chip and their statuses. An example is shown below, where yellow indicates failed chips, and turquoise represents functional chips:
Python 3.9:
ML modules:
Data modules
Plotting modules
Jupyter Notebook
A presentation summarizing the data analysis and results can be found here.
This project explores over 800,000 real wafer maps from the MIR-WM811K Corpus, made public by the MIR Lab at the National Taiwan University:
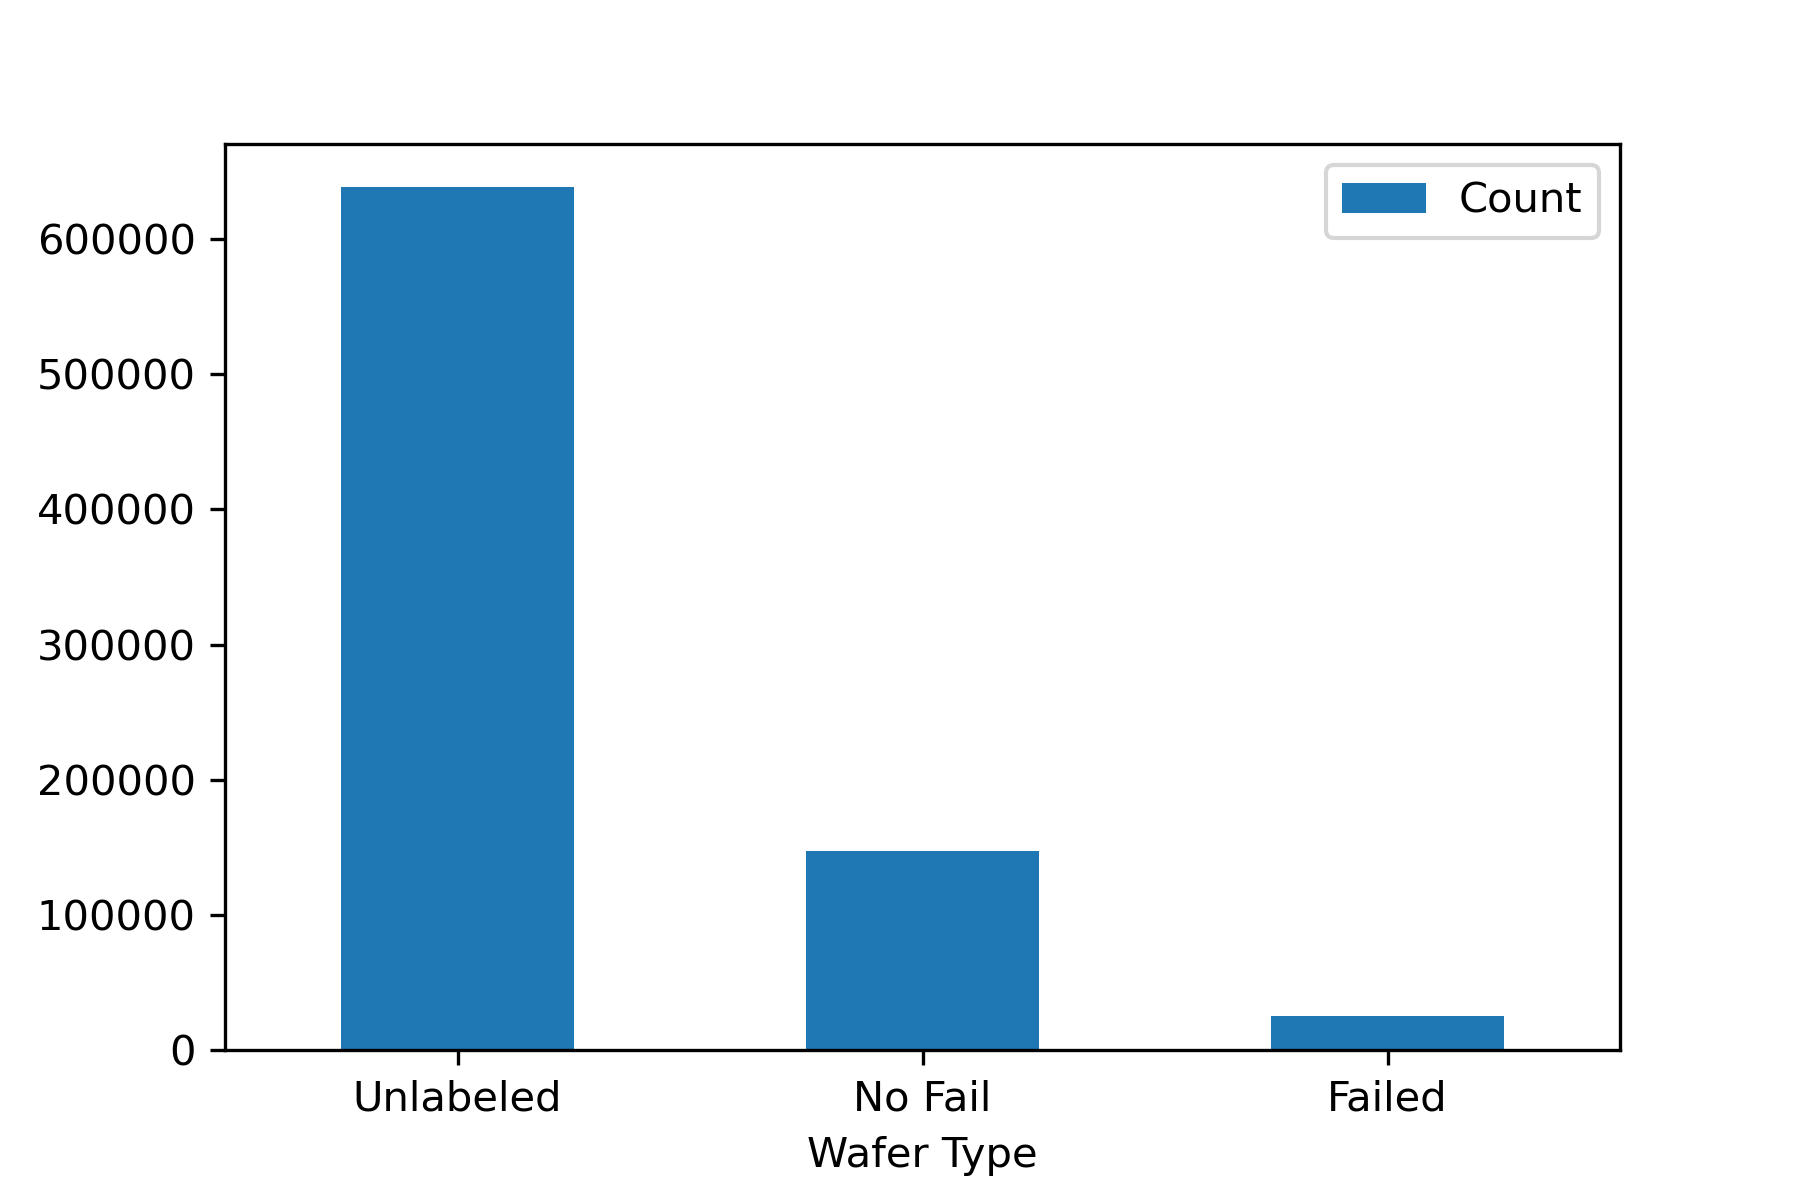
The data started in the form of a pickle file, so I converted it to a pandas DataFrame for easier processing. The dimensions of the DataFrame were 811,457 rows by 6 columns. The first column contained the main data, which had entries in the format of 2-D numpy arrays of the wafer maps, with each element labeled as 0, 1, or 2, for failed, functional, and space outside of the wafer. I combined the functional and empty space categories to make the maps binary. Most of the samples were unlabeled, and among the labeled samples, only 25,519 were classified as "failed." I dropped all but these 25,519 rows, under the assumption that each wafer can be flagged ahead of time as failed by applying a simple chip yield threshold.
First, I explored the wafer maps, by plotting them as images. Below are examples from each failure type:

Next, I explored the class distributions, and was suprised to find significant class imbalances in the training data:


I trained a convolutional neural network (CNN) for this classification project, because it is typical in the application of image recognition. I adapted a simple CNN model used for recognition of the MNIST handwritten digits corpus. A model diagram of this CNN model can be found here. An important feature of the model is the final activation function is a softmax, which is useful for multiclass classification problems because it assigns a probability of each sample belonging to each class
I trained the CNN model by testing ranges of (hyper)parameters including optimizer type, learning rate, number of epochs, batch size, kernel size, and image size. The procedure I followed was to train and evaluate the model with k-fold cross-validation (k=5), which was useful for hyperparameter tuning. Then, I trained the model on the entire training dataset, and evaluated its performance on the test set. I included the metrics of recall, precision and accuracy to be informative, but I only focused on optimizing the recall.
Without tuning the parameters, I found that the initial results of testing could use improvement. In particular, the model performed significantly worse on the test set than the validation set. I attempted to address this with SMOTE oversampling, to oversample the underrepresented classes in the training set. This generated synthetic samples using a variation of a k-Nearest Neighbors (k-NN) algorithm. I oversampled until all classes had as many samples as the plurality class, roughly 8,000.
However, once I tested the modeled by training with the SMOTE oversampled data, it resulted in significantly worse recall and accuracy, and marginally improved precision. A comparison is below:
Before SMOTE: Test recall = 0.46
After SMOTE: Test recall = 0.22
Based on this, I scrapped the idea. However, the class imbalance issue could be further explored in the future using techniques such as imbalanced class weights or augmented training data generators.
After testing various hyperparameters I settled on the values below, which resulted in the best performance using the metric of recall.

Note that the validation set performs better than the training set, which is not an error, but is likely due to the sensitivity of sampling of the underrepresented classes for training and validation.
Here were the final parameters and results:

Author: Christopher Shaffer
此处可能存在不合适展示的内容,页面不予展示。您可通过相关编辑功能自查并修改。
如您确认内容无涉及 不当用语 / 纯广告导流 / 暴力 / 低俗色情 / 侵权 / 盗版 / 虚假 / 无价值内容或违法国家有关法律法规的内容,可点击提交进行申诉,我们将尽快为您处理。


