

代码拉取完成,页面将自动刷新
![]()

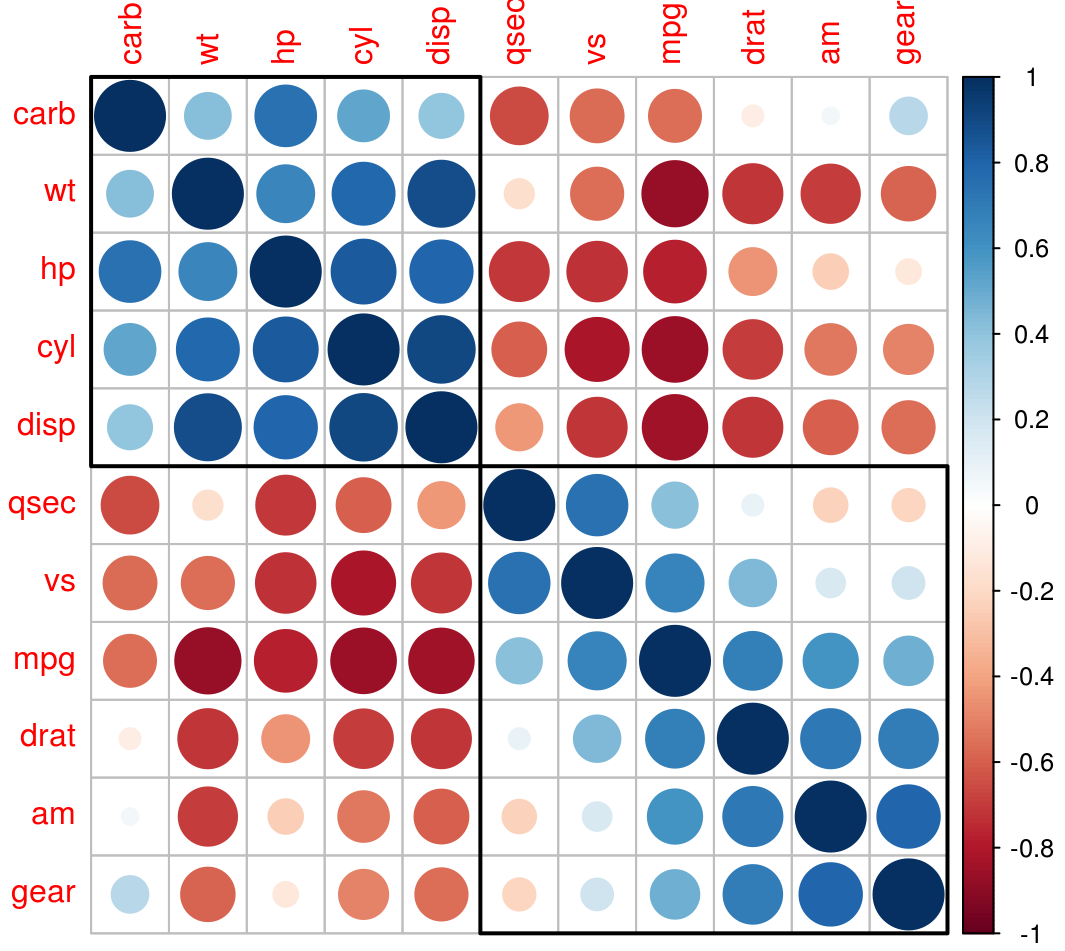
R package corrplot provides a visual exploratory tool on correlation matrix that supports automatic variable reordering to help detect hidden patterns among variables.
corrplot is very easy to use and provides a rich array of plotting options in visualization method, graphic layout, color, legend, text labels, etc. It also provides p-values and confidence intervals to help users determine the statistical significance of the correlations.
For examples, see its online vignette.
This package is licensed under the MIT license, and available on CRAN: https://cran.r-project.org/package=corrplot.
library(corrplot)
M = cor(mtcars)
corrplot(M, order = 'hclust', addrect = 2)
To download the release version of the package on CRAN, type the following at the R command line:
install.packages('corrplot')
To download the development version of the package, type the following at the R command line:
devtools::install_github('taiyun/corrplot', build_vignettes = TRUE)
To cite corrplot properly, call the R built-in command
citation('corrplot') as follows:
citation('corrplot')
If you encounter a clear bug, please file a minimal reproducible example on github.
此处可能存在不合适展示的内容,页面不予展示。您可通过相关编辑功能自查并修改。
如您确认内容无涉及 不当用语 / 纯广告导流 / 暴力 / 低俗色情 / 侵权 / 盗版 / 虚假 / 无价值内容或违法国家有关法律法规的内容,可点击提交进行申诉,我们将尽快为您处理。
1. 开源生态
2. 协作、人、软件
3. 评估模型


