

代码拉取完成,页面将自动刷新
帮助用户在python环境使用echarts g2plot 绘图
不同于pyecharts,不对echarts 概念和属性进行python映射和二次抽象,保证库不依赖于特定echarts版本
实现了 python配置<=>JavaScript配置的双向互转
同时借鉴plotly.express 封装了简单图表类型可视化函数
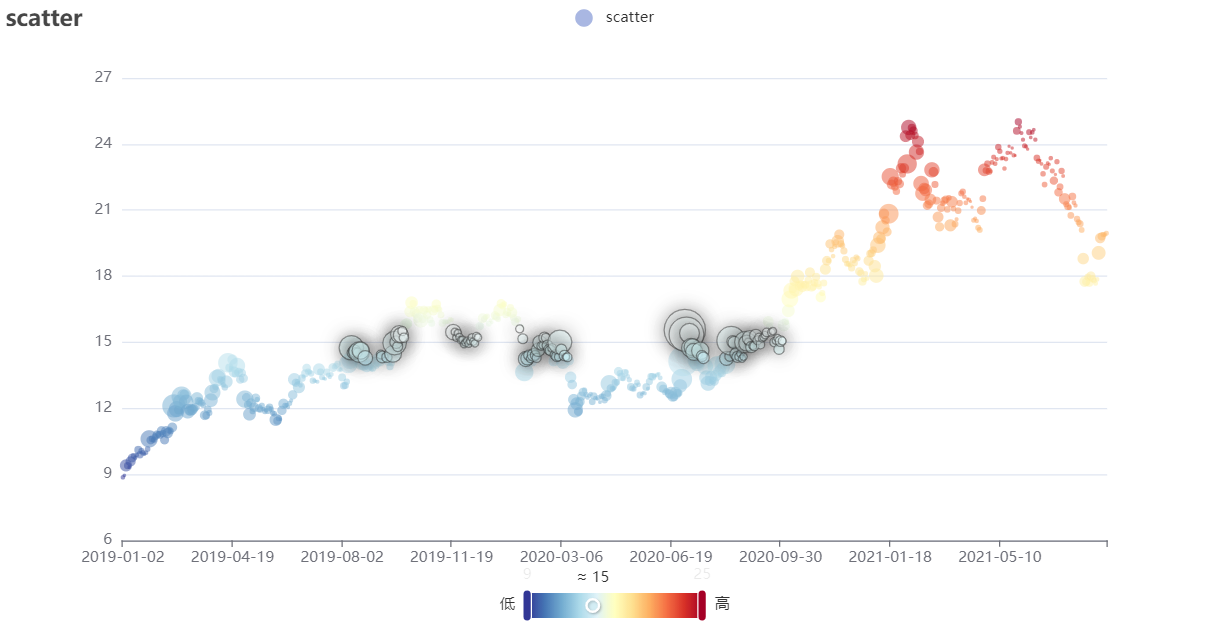
import chartspy.express as ex
ex.scatter_echarts(df, x='数量', y='价格', size='数量', group='水果', size_max=50, height='250px', title='scatter')
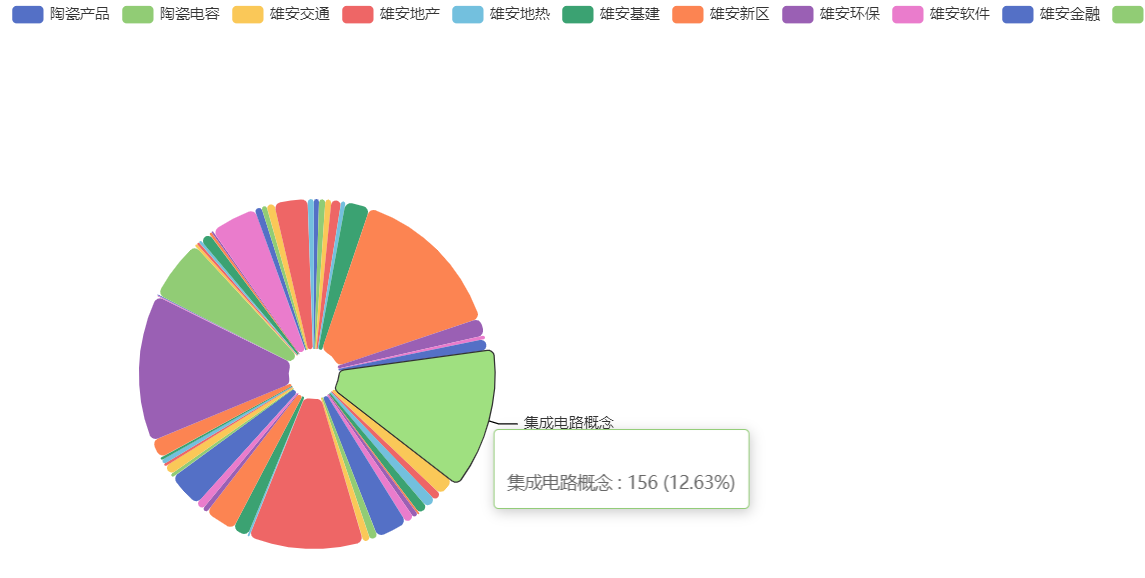
ex.pie_echarts(df, name='水果', value='数量', rose_type='area', title="pie2", height='350px')
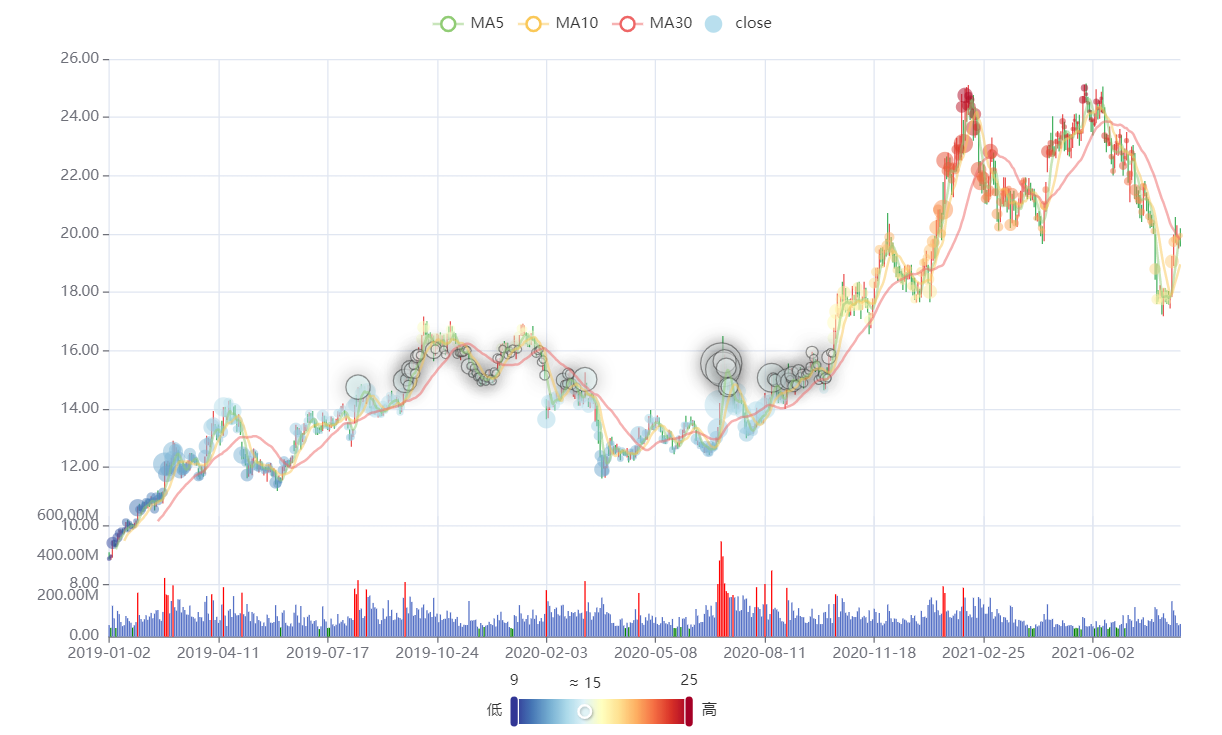
ex.candlestick_echarts(df, left='5%', mas=[5, 10, 30], title='平安银行')
!!! note ""
!!! note ""
!!! note ""
手工书写,参考 echarts配置手册
from chartspy import Echarts, Tools

options = {
    'xAxis': {},
    'yAxis': {},
    'series': [{
        'symbolSize': 20,
        'data': [
            [10.0, 8.04],
            [8.07, 6.95],
            [13.0, 7.58],
            [9.05, 8.81],
            [11.0, 8.33]
        ],
        'type': 'scatter'
    }]
}
Echarts(options, height='600px', title='散点图测试').render_notebook()
from chartspy import G2PLOT, Tools

# G2PLOT
df= ...
# Echarts
options = {
    'xField':'time',
    'yField':'close'
}
G2PLOT(df,plot_type='Line',options=options).render_notebook()
半自动,从echarts示例 拷贝js配置,自动生成对应的python配置
convert_js_to_dict(js_str,print_dict=True) 会在控制台打印python 配置, 粘贴进行二次加工
from chartspy import Echarts, Tools, Js

js_str = """
{
    xAxis: {
        type: 'category',
        data: ['Mon', 'Tue', 'Wed', 'Thu', 'Fri', 'Sat', 'Sun']
    },
    yAxis: {
        type: 'value'
    },
    series: [{
        data: [820, 932, 901, 934, 1290, 1330, 1320],
        type: 'line',
        smooth: true
    }]
}
"""
options = Tools.convert_js_to_dict(js_str, print_dict=False)
Echarts(options, height='300px', width='300px').render_notebook()
pip install chartspy
pip uninstall chartspy -y && pip install chartspy
默认指向最新版,可以修改成指定版本
from  chartspy import  echarts
from chartspy import g2plot

echarts.ECHARTS_JS_URL = "https://unpkg.com/echarts@latest/dist/echarts.min.js"
g2plot.G2PLOT_JS_URL = "..."

此处可能存在不合适展示的内容,页面不予展示。您可通过相关编辑功能自查并修改。
如您确认内容无涉及 不当用语 / 纯广告导流 / 暴力 / 低俗色情 / 侵权 / 盗版 / 虚假 / 无价值内容或违法国家有关法律法规的内容,可点击提交进行申诉,我们将尽快为您处理。


