

代码拉取完成,页面将自动刷新
Flexible self-contained PostgreSQL metrics monitoring/dashboarding solution. Supports monitoring PG versions 9.0 to 13 out of the box.
https://pgwatch2.readthedocs.io/en/latest/
For the fastest setup experience Docker images are provided via Docker Hub (for a Docker quickstart see here). For custom setups see the according chapter from documentation or turn to the "Releases" tab for pre-built DEB / RPM / Tar packages directly.
# fetch and run the latest Docker image, exposing Grafana on port 3000, the administrative web UI on port 8080
# and the internal configuration and metrics DB on localhost port 5432
docker run -d --restart=unless-stopped --name pw2 \
  -p 3000:3000 -p 8080:8080 -p 127.0.0.1:5432:5432 \
  -e PW2_TESTDB=true \
  cybertec/pgwatch2-postgres:latest
After some minutes you could open the "db-overview" dashboard and start looking at metrics. For defining your own dashboards you need to log in as admin (admin/pgwatch2admin).
NB! If you don't want to add the "test" database (the pgwatch2 configuration db) for monitoring, remove the NOTESTDB=1 env parameter when launching the container.
The behaviour of the Docker images can be customized in many ways - for a complete list of all supported Docker environment variables see ENV_VARIABLES.md.
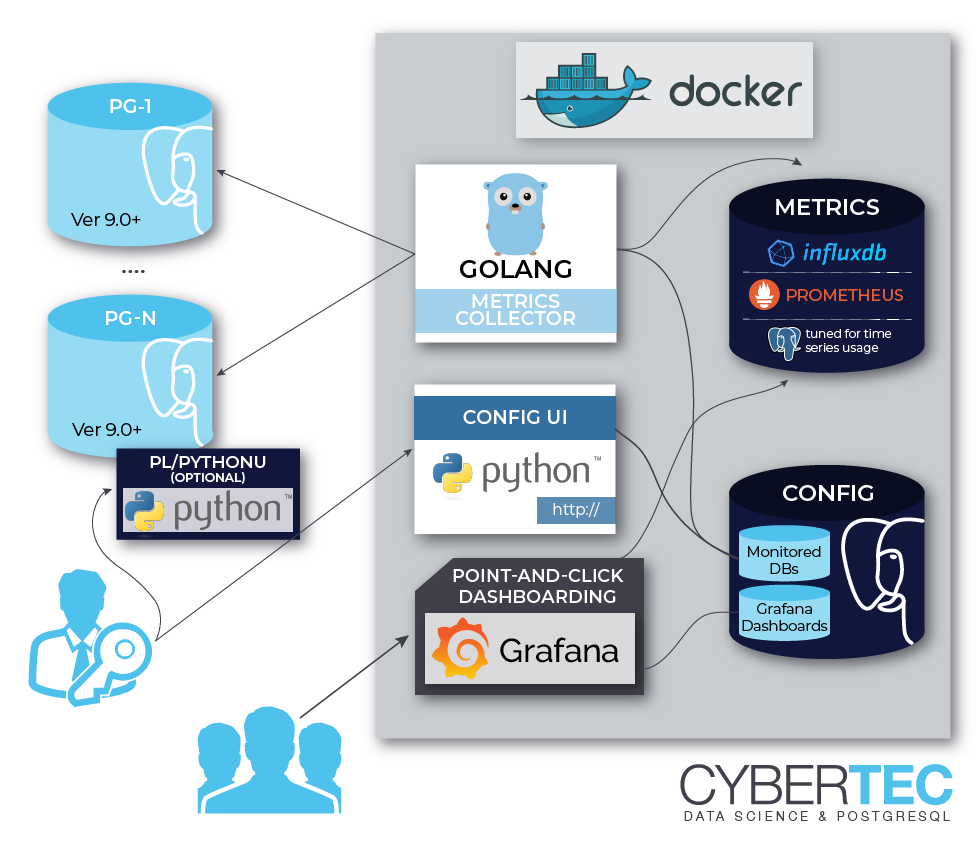
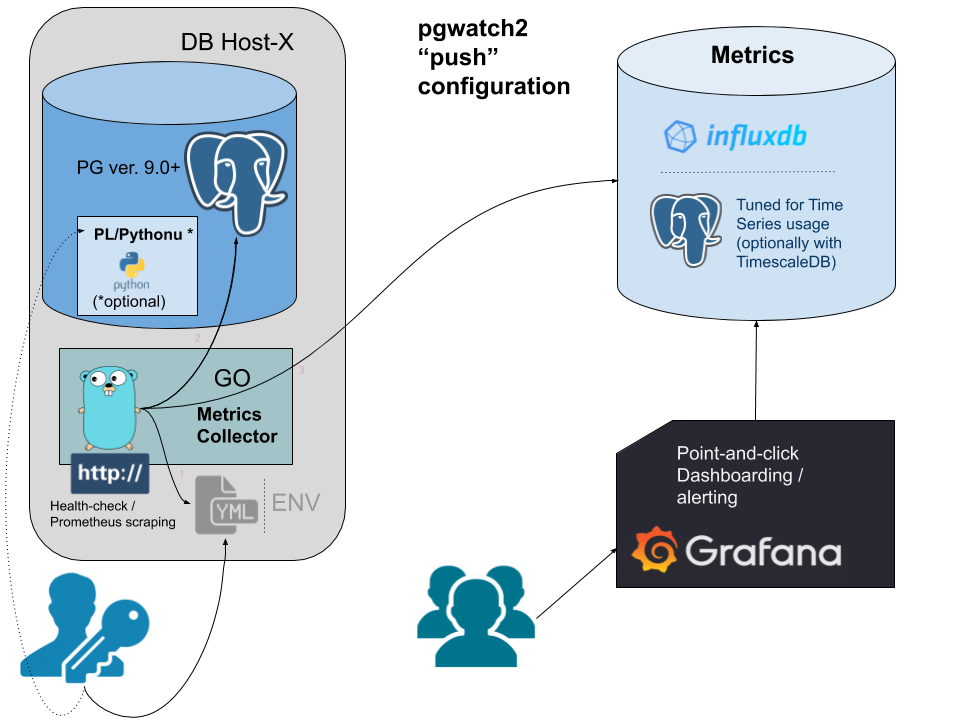
pgwatch2 can be deployed in various configurations, as all components are "loosely coupled". This means that you can very well reuse your existing PostgreSQL or Grafana installations, adding only pgwatch2 specific components - see here for more information.
Two most common deployment options are:
As a base requirement you'll need a login user (non-superuser suggested) for connecting to your PostgreSQL servers and fetching metrics queries. Using a user named "pgwatch2" is recommended though, as otherwise your might need to adjust some scripts for advanced monitoring options, in case an unpriveleged monitoring account is used. More documentation on that can be found here.
CREATE ROLE pgwatch2 WITH LOGIN PASSWORD 'secret';
-- NB! For very important databases it might make sense to ensure that the user
-- account used for monitoring can only open a limited number of connections (there are according checks in code also though)
ALTER ROLE pgwatch2 CONNECTION LIMIT 3;
GRANT pg_monitor TO pgwatch2;   -- system role available for v10+ servers to reduce superuser usage
Additionally, for extra insights on "to be monitored" databases, it's recommended to install and activate the pg_stat_statement contrib extension and enable the track_io_timing parameter in server configuration.
If for security reasons a plain unprivileged database account is used for metrics gathering, this would mean that some protected PostgreSQL internal statistics cannot be fetched. This might be just OK (there's also an "unprivileged" preset), but it's also possible to expose such protected information in a safe and controlled way via a set of predefined SECURITY DEFINER functions.
To be executed on the "to be monitored" database:
psql -h mydb.com -U superuser -f /etc/pgwatch2/metrics/00_helpers/$pgver/get_stat_activity/$pgver/metric.sql mydb
psql -h mydb.com -U superuser -f /etc/pgwatch2/metrics/00_helpers/get_stat_statements/$pgver/metric.sql mydb
psql -h mydb.com -U superuser -f /etc/pgwatch2/metrics/00_helpers/get_stat_replication/$pgver/metric.sql mydb
NB! By default the "helpers" assume that a role called "pgwatch2" will be used for metrics gathering. If not so, you need to change the SQL definitions.
Similar to above described plain SQL helper functions, one can also create such wrapper functions in any PostgreSQL supported PL-language, like most commonly PL/Python. This will allow to return metrics on any information deemed useful. Main use case though is to extract OS statistics like CPU, RAM, disk utilization and backup status over regular Postgres connections. The pgwatch2 project provides a good set of such wrappers, so that in simpler cases you would not need any additional system monitoring tools.
# first install the Python bindings for Postgres
apt install postgresql-plpython3-XY
# yum install postgresqlXY-plpython3

psql -c "CREATE EXTENSION plpython3u" mydb
psql -f /etc/pgwatch2/metrics/00_helpers/get_load_average/9.1/metric.sql mydb

# psutil helpers are only needed when full set of common OS metrics is wanted
apt install python3-psutil
psql -f /etc/pgwatch2/metrics/00_helpers/get_psutil_cpu/9.1/metric.sql mydb
psql -f /etc/pgwatch2/metrics/00_helpers/get_psutil_mem/9.1/metric.sql mydb
psql -f /etc/pgwatch2/metrics/00_helpers/get_psutil_disk/9.1/metric.sql mydb
psql -f /etc/pgwatch2/metrics/00_helpers/get_psutil_disk_io_total/9.1/metric.sql mydb
Metrics in pgwatch2 are named SQL queries that can return pretty much everything you find useful. Metrocs can have different query text versions for different target PostgreSQL versions, also optionally taking into account recovery state (primary / standby) and as of v1.8 also versions of installed extensions. Query output is automatically stored into the metric DB and optionally also indexed if a column's name is prefixed with the "tag_" modifier.
A sample custom metric looks like that:
  -- a sample metric
  SELECT
    (extract(epoch from now()) * 1e9)::int8 as epoch_ns,
    extract(epoch from (now() - pg_postmaster_start_time()))::int8 as postmaster_uptime_s,
    case when pg_is_in_recovery() then 1 else 0 end as in_recovery_int;
From v1.4.0 one can also deploy pgwatch2 gatherer daemons de-centrally without a configuration database, based on YAML config files. This means a more resilient setup (the only point of failure will be the metrics storage DB) and more security, so that even superuser roles can be used on the agents running locally on monitored database. See here for details.
From v1.4.0 it's also possible to run the gatherer daemon in ad-hoc / test mode, by giving a single standard connection string as input, and optionally also specifying the metrics to monitor (a Preset Config name or a custom JSON string). In that case there is no need for the central Postgres "Config DB", nor any YAML files, i.e. the setup can be based purely on environment variables, which can be beneficial for Cloud setups. Details here.
# launching in ad-hoc / test mode
docker run --rm -d --name pw2_temp \
    -p 3000:3000 \
    -e PW2_ADHOC_CONN_STR="postgresql://postgres:postgres@172.17.0.1:5432/postgres" \
    -e PW2_ADHOC_CONFIG=unprivileged cybertec/pgwatch2-postgres
In v1.6.0 support for one of the most popular metrics gathering solutions – Prometheus, was added. When the "datastore" parameter is set to "prometheus" then the pgwatch2 metrics collector doesn't do any normal interval-based fetching but listens on port 9187 (changeable) for scrape requests configured and performed on Prometheus side.
In this mode the pgwatch2 agents should be running on all database hosts separately, not centrally. While technically possible though, it would counter the core idea of Prometheus and would make scrapes also longer, risking timeouts. There's also a separate "Preset Config" named "prometheus". More details.
Cloud deployments of pgwatch2 should be no problem - there are some simple K8s deployment templates provided and also a Helm chart in the "openshift_k8s" folder.
Helm setup values should be reviewed / edited in ./openshift_k8s/helm-chart, whereas installation is done by the following command:
cd openshift_k8s
helm install ./helm-chart --name pgwatch2 -f chart-values.yml
Please have a look at openshift_k8s/helm-chart/values.yaml to get additional information of configurable options.
Feedback, suggestions, problem reports and pull requests are very much appreciated.
此处可能存在不合适展示的内容,页面不予展示。您可通过相关编辑功能自查并修改。
如您确认内容无涉及 不当用语 / 纯广告导流 / 暴力 / 低俗色情 / 侵权 / 盗版 / 虚假 / 无价值内容或违法国家有关法律法规的内容,可点击提交进行申诉,我们将尽快为您处理。


