

代码拉取完成,页面将自动刷新
🎨 PyG2Plot 是
@AntV/G2Plot在 Python3 上的封装。 G2Plot 是一套简单、易用、并具备一定扩展能力和组合能力的统计图表库,基于图形语法理论搭建而成。

![]()

相关文档: English README · 绘制常用统计图表 · 在 Jupyter 中使用 · 技术原理
$ pip install pyg2plot
from pyg2plot import Plot
line = Plot("Line")
line.set_options({
"data": [
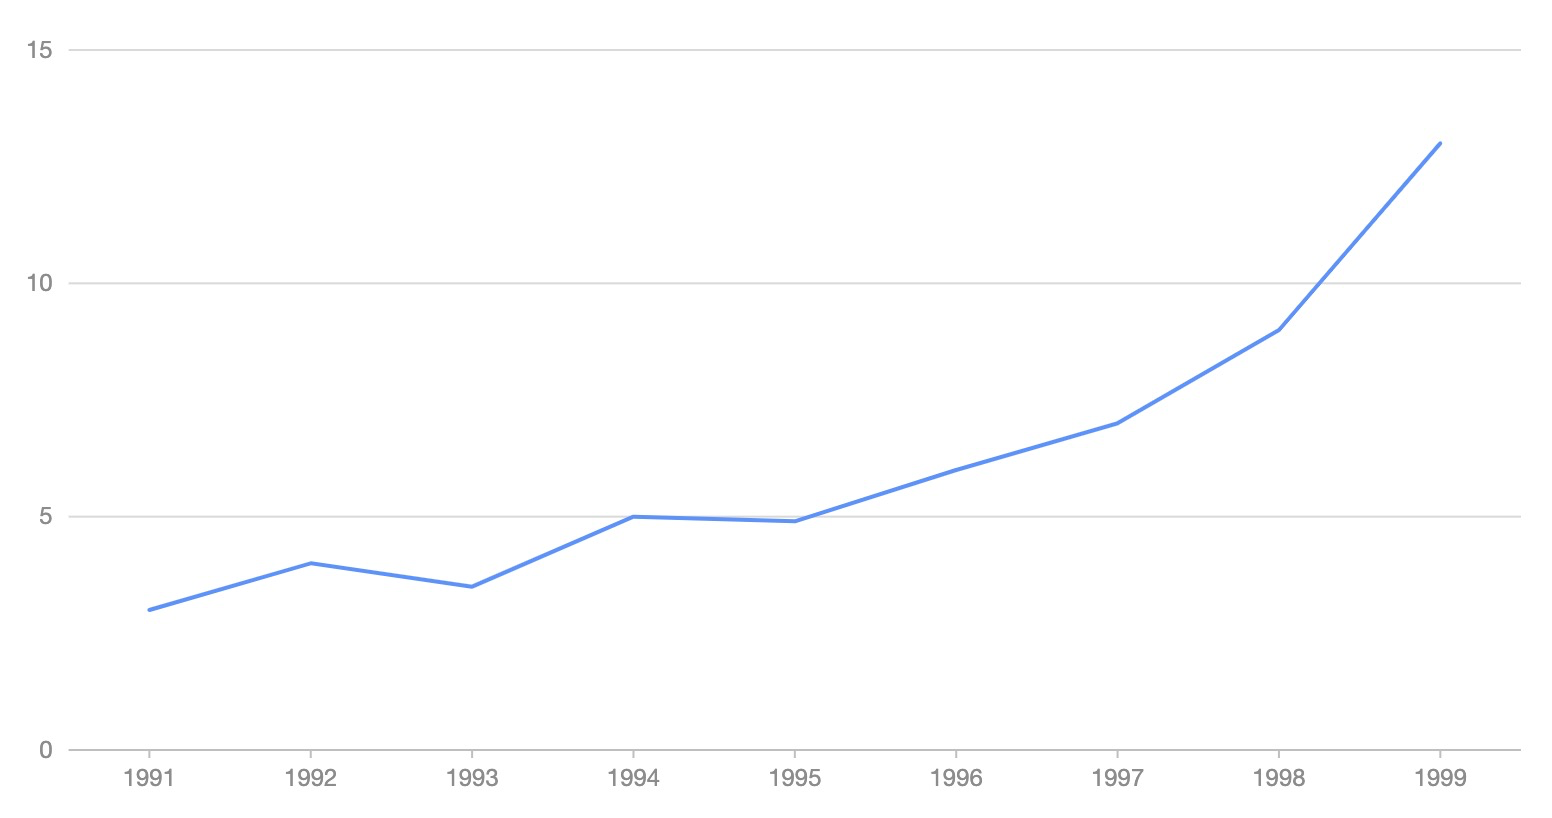
{ "year": "1991", "value": 3 },
{ "year": "1992", "value": 4 },
{ "year": "1993", "value": 3.5 },
{ "year": "1994", "value": 5 },
{ "year": "1995", "value": 4.9 },
{ "year": "1996", "value": 6 },
{ "year": "1997", "value": 7 },
{ "year": "1998", "value": 9 },
{ "year": "1999", "value": 13 },
],
"xField": "year",
"yField": "value",
})
# 1. 渲染成 html 文件
line.render("plot.html")
# 2. 渲染成 html 字符串
line.render_html()
from pyg2plot import Plot

line = Plot("Line")

line.set_options({
  "height": 400, # set a default height in jupyter preview
  "data": [
    { "year": "1991", "value": 3 },
    { "year": "1992", "value": 4 },
    { "year": "1993", "value": 3.5 },
    { "year": "1994", "value": 5 },
    { "year": "1995", "value": 4.9 },
    { "year": "1996", "value": 6 },
    { "year": "1997", "value": 7 },
    { "year": "1998", "value": 9 },
    { "year": "1999", "value": 13 },
  ],
  "xField": "year",
  "yField": "value",
})

line.render_notebook()
目前 pyg2plot 只提供简单的一个 API。
Plot(plot_type: str): 获取 Plot 对应的类实例。
plot.set_options(options: object): 给图表实例设置一个 G2Plot 图形的配置,文档可以直接参考 G2Plot 官网,未进行任何二次数据结构包装。
plot.render(path, env, **kwargs): 渲染出一个 HTML 文件,同时可以传入文件的路径,以及 jinja2 env 和 kwargs 参数。
plot.render_notebook(env, **kwargs): 将图形渲染到 jupyter 的预览。
plot.render_html(env, **kwargs): 渲染出 HTML 字符串,同时可以传入 jinja2 env 和 kwargs 参数。
plot.dump_js_options(env, **kwargs): 输出 Javascript 的 option 配置结构,同时可以传入 jinja2 env 和 kwargs 参数,可以用于 Server 中的 HTTP 结构返回数据结构。
更多区分 Plot 级别的语法糖 API 还在筹备中。
MIT@hustcc.
此处可能存在不合适展示的内容,页面不予展示。您可通过相关编辑功能自查并修改。
如您确认内容无涉及 不当用语 / 纯广告导流 / 暴力 / 低俗色情 / 侵权 / 盗版 / 虚假 / 无价值内容或违法国家有关法律法规的内容,可点击提交进行申诉,我们将尽快为您处理。


