

代码拉取完成,页面将自动刷新

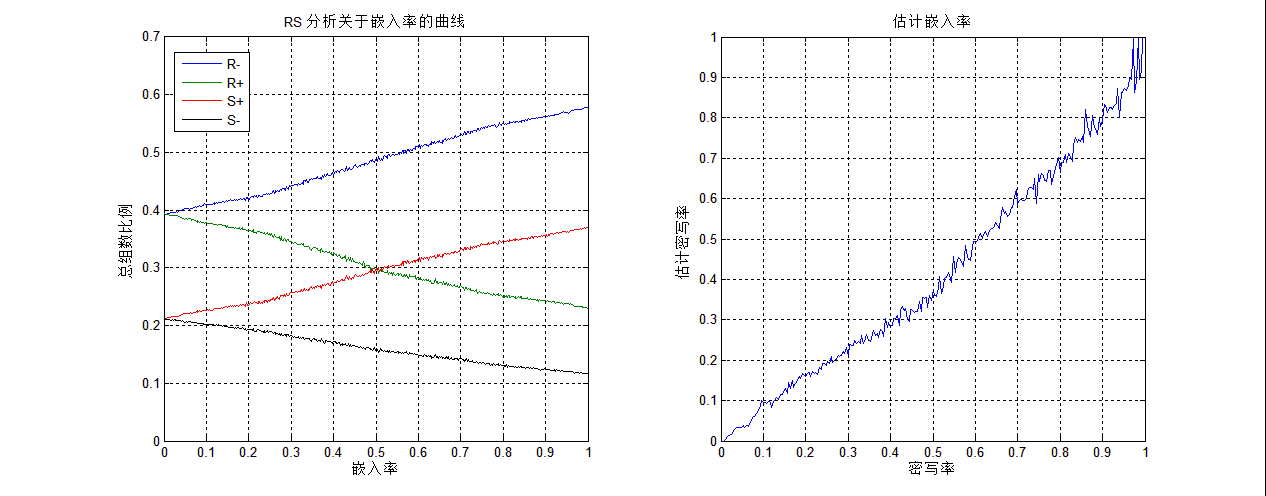
This is a Matlab program for steganalysis, It can draw the plot to show the relationship between embed rate and RS value.
Start the it with compute_plot, and you may need to specific the image name and the increase step of the embed rate.
此处可能存在不合适展示的内容,页面不予展示。您可通过相关编辑功能自查并修改。
如您确认内容无涉及 不当用语 / 纯广告导流 / 暴力 / 低俗色情 / 侵权 / 盗版 / 虚假 / 无价值内容或违法国家有关法律法规的内容,可点击提交进行申诉,我们将尽快为您处理。
1. 开源生态
2. 协作、人、软件
3. 评估模型


