

代码拉取完成,页面将自动刷新

![]()
![]()
![]()

Diagram as Code.
Diagrams lets you draw the cloud system architecture in Python code. It was born for prototyping a new system architecture design without any design tools. You can also describe or visualize the existing system architecture as well. Diagrams currently supports main major providers including: AWS, Azure, GCP, Kubernetes, Alibaba Cloud, Oracle Cloud etc... It also supports On-Premise nodes, SaaS and major Programming frameworks and languages.
Diagram as Code also allows you to track the architecture diagram changes in any version control system.
NOTE: It does not control any actual cloud resources nor does it generate cloud formation or terraform code. It is just for drawing the cloud system architecture diagrams.
It requires Python 3.7 or higher, check your Python version first.
It uses Graphviz to render the diagram, so you need to install Graphviz to use diagrams. After installing graphviz (or already have it), install the diagrams.
macOS users can download the Graphviz via
brew install graphvizif you're using Homebrew.
# using pip (pip3)
$ pip install diagrams

# using pipenv
$ pipenv install diagrams

# using poetry
$ poetry add diagrams
You can start with quick start. Check out guides for more details, and you can find all available nodes list in here.
| Event Processing | Stateful Architecture | Advanced Web Service |
|---|---|---|
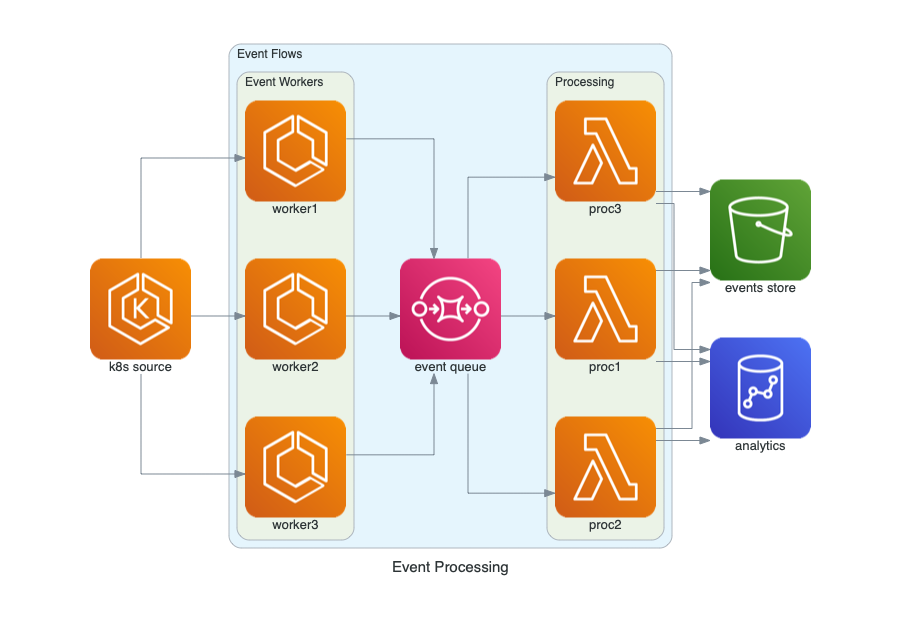 |
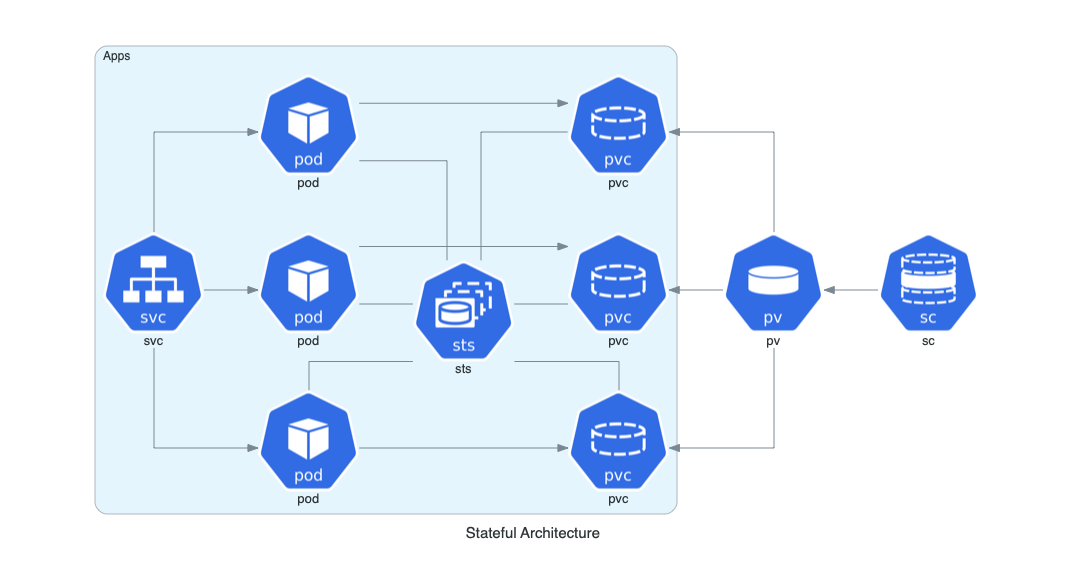 |
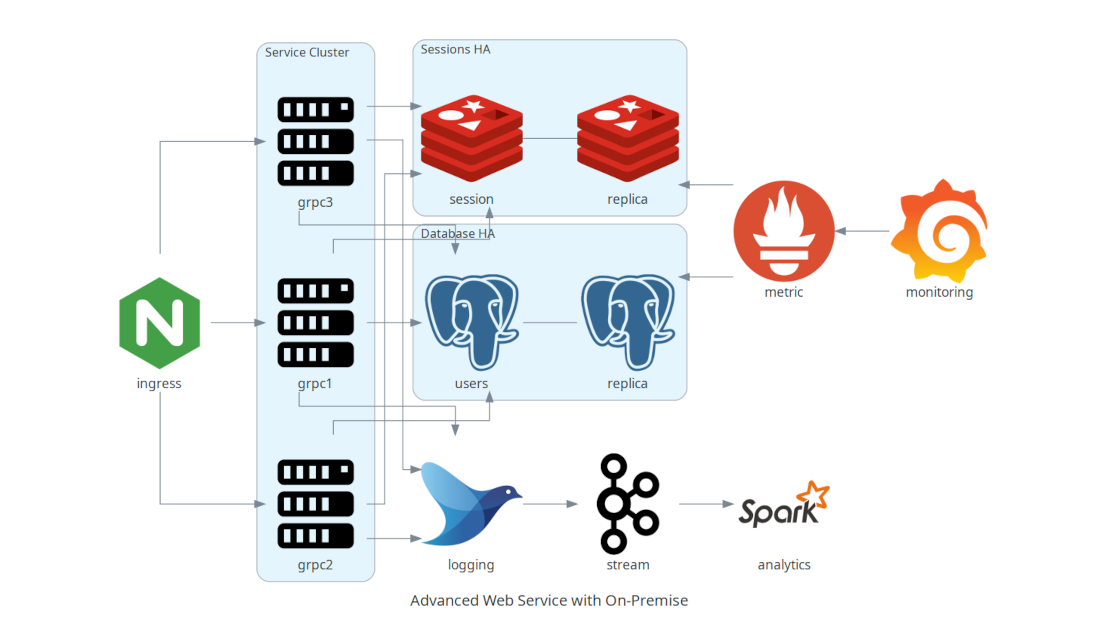 |
You can find all the examples on the examples page.
To contribute to diagram, check out contribution guidelines.
Let me know if you are using diagrams! I'll add you in showcase page. (I'm working on it!) :)
Apache Airflow is the most popular data workflow Orchestrator. Airflow uses Diagrams to generate architecture diagrams in their documentation.
Cloudiscovery helps you to analyze resources in your cloud (AWS/GCP/Azure/Alibaba/IBM) account. It allows you to create a diagram of analyzed cloud resource map based on this Diagrams library, so you can draw your existing cloud infrastructure with Cloudiscovery.
Airflow Diagrams is an Airflow plugin that aims to easily visualise your Airflow DAGs on service level from providers like AWS, GCP, Azure, etc. via diagrams.
此处可能存在不合适展示的内容,页面不予展示。您可通过相关编辑功能自查并修改。
如您确认内容无涉及 不当用语 / 纯广告导流 / 暴力 / 低俗色情 / 侵权 / 盗版 / 虚假 / 无价值内容或违法国家有关法律法规的内容,可点击提交进行申诉,我们将尽快为您处理。


