

代码拉取完成,页面将自动刷新
TuChart is a visualization tool for the Chinese stock market, based on Tushare and Echarts.


Install all necessary dependencies
pip install pyecharts==0.2.0
pip install tushare==0.8.6
To install Tuchart, enter
pip install tuchart
in your terminal
then, under your tuchart directory, e.g:
/user/anaconda/lib/python2.7/site-packages/tuchart
runpython main.py
The exact path of tuchart in your directory can be located bypip show tuchart:
 add
add/tuchartto pinpoint the tuchart directory.
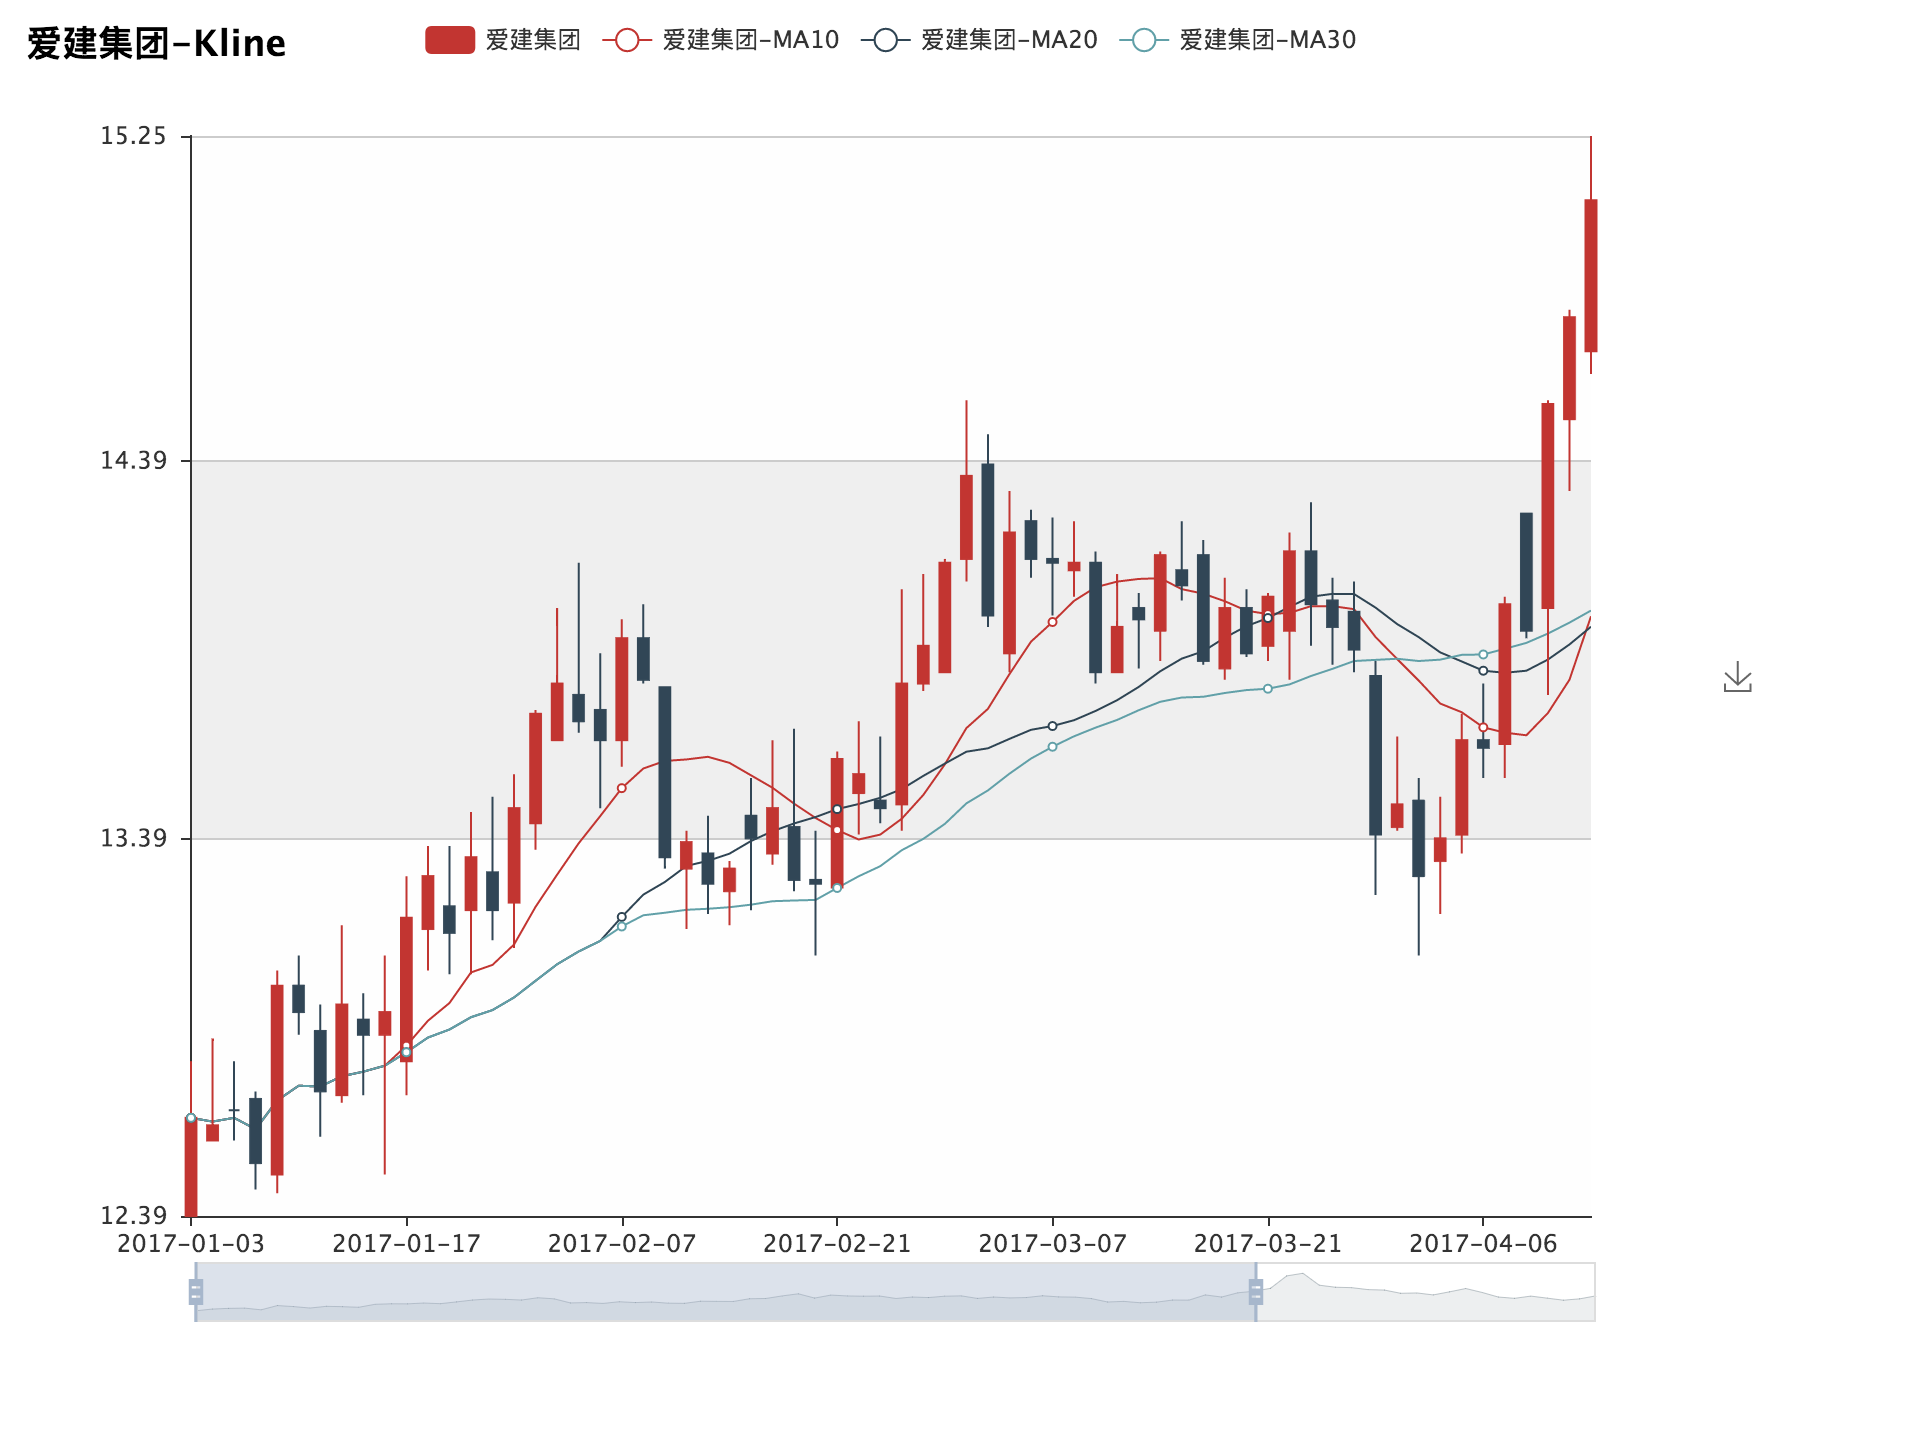
Right click to choose the name of stock and type of data you would like to plot. Then, press the green arrow button to plot. Due to the size constraints, it is recommended to plot fewer than 5 graphs at the same time.

High frequency data is calculated from tick data of your chosen day. Algorithm: 如何用TICK数据生成分钟线数据
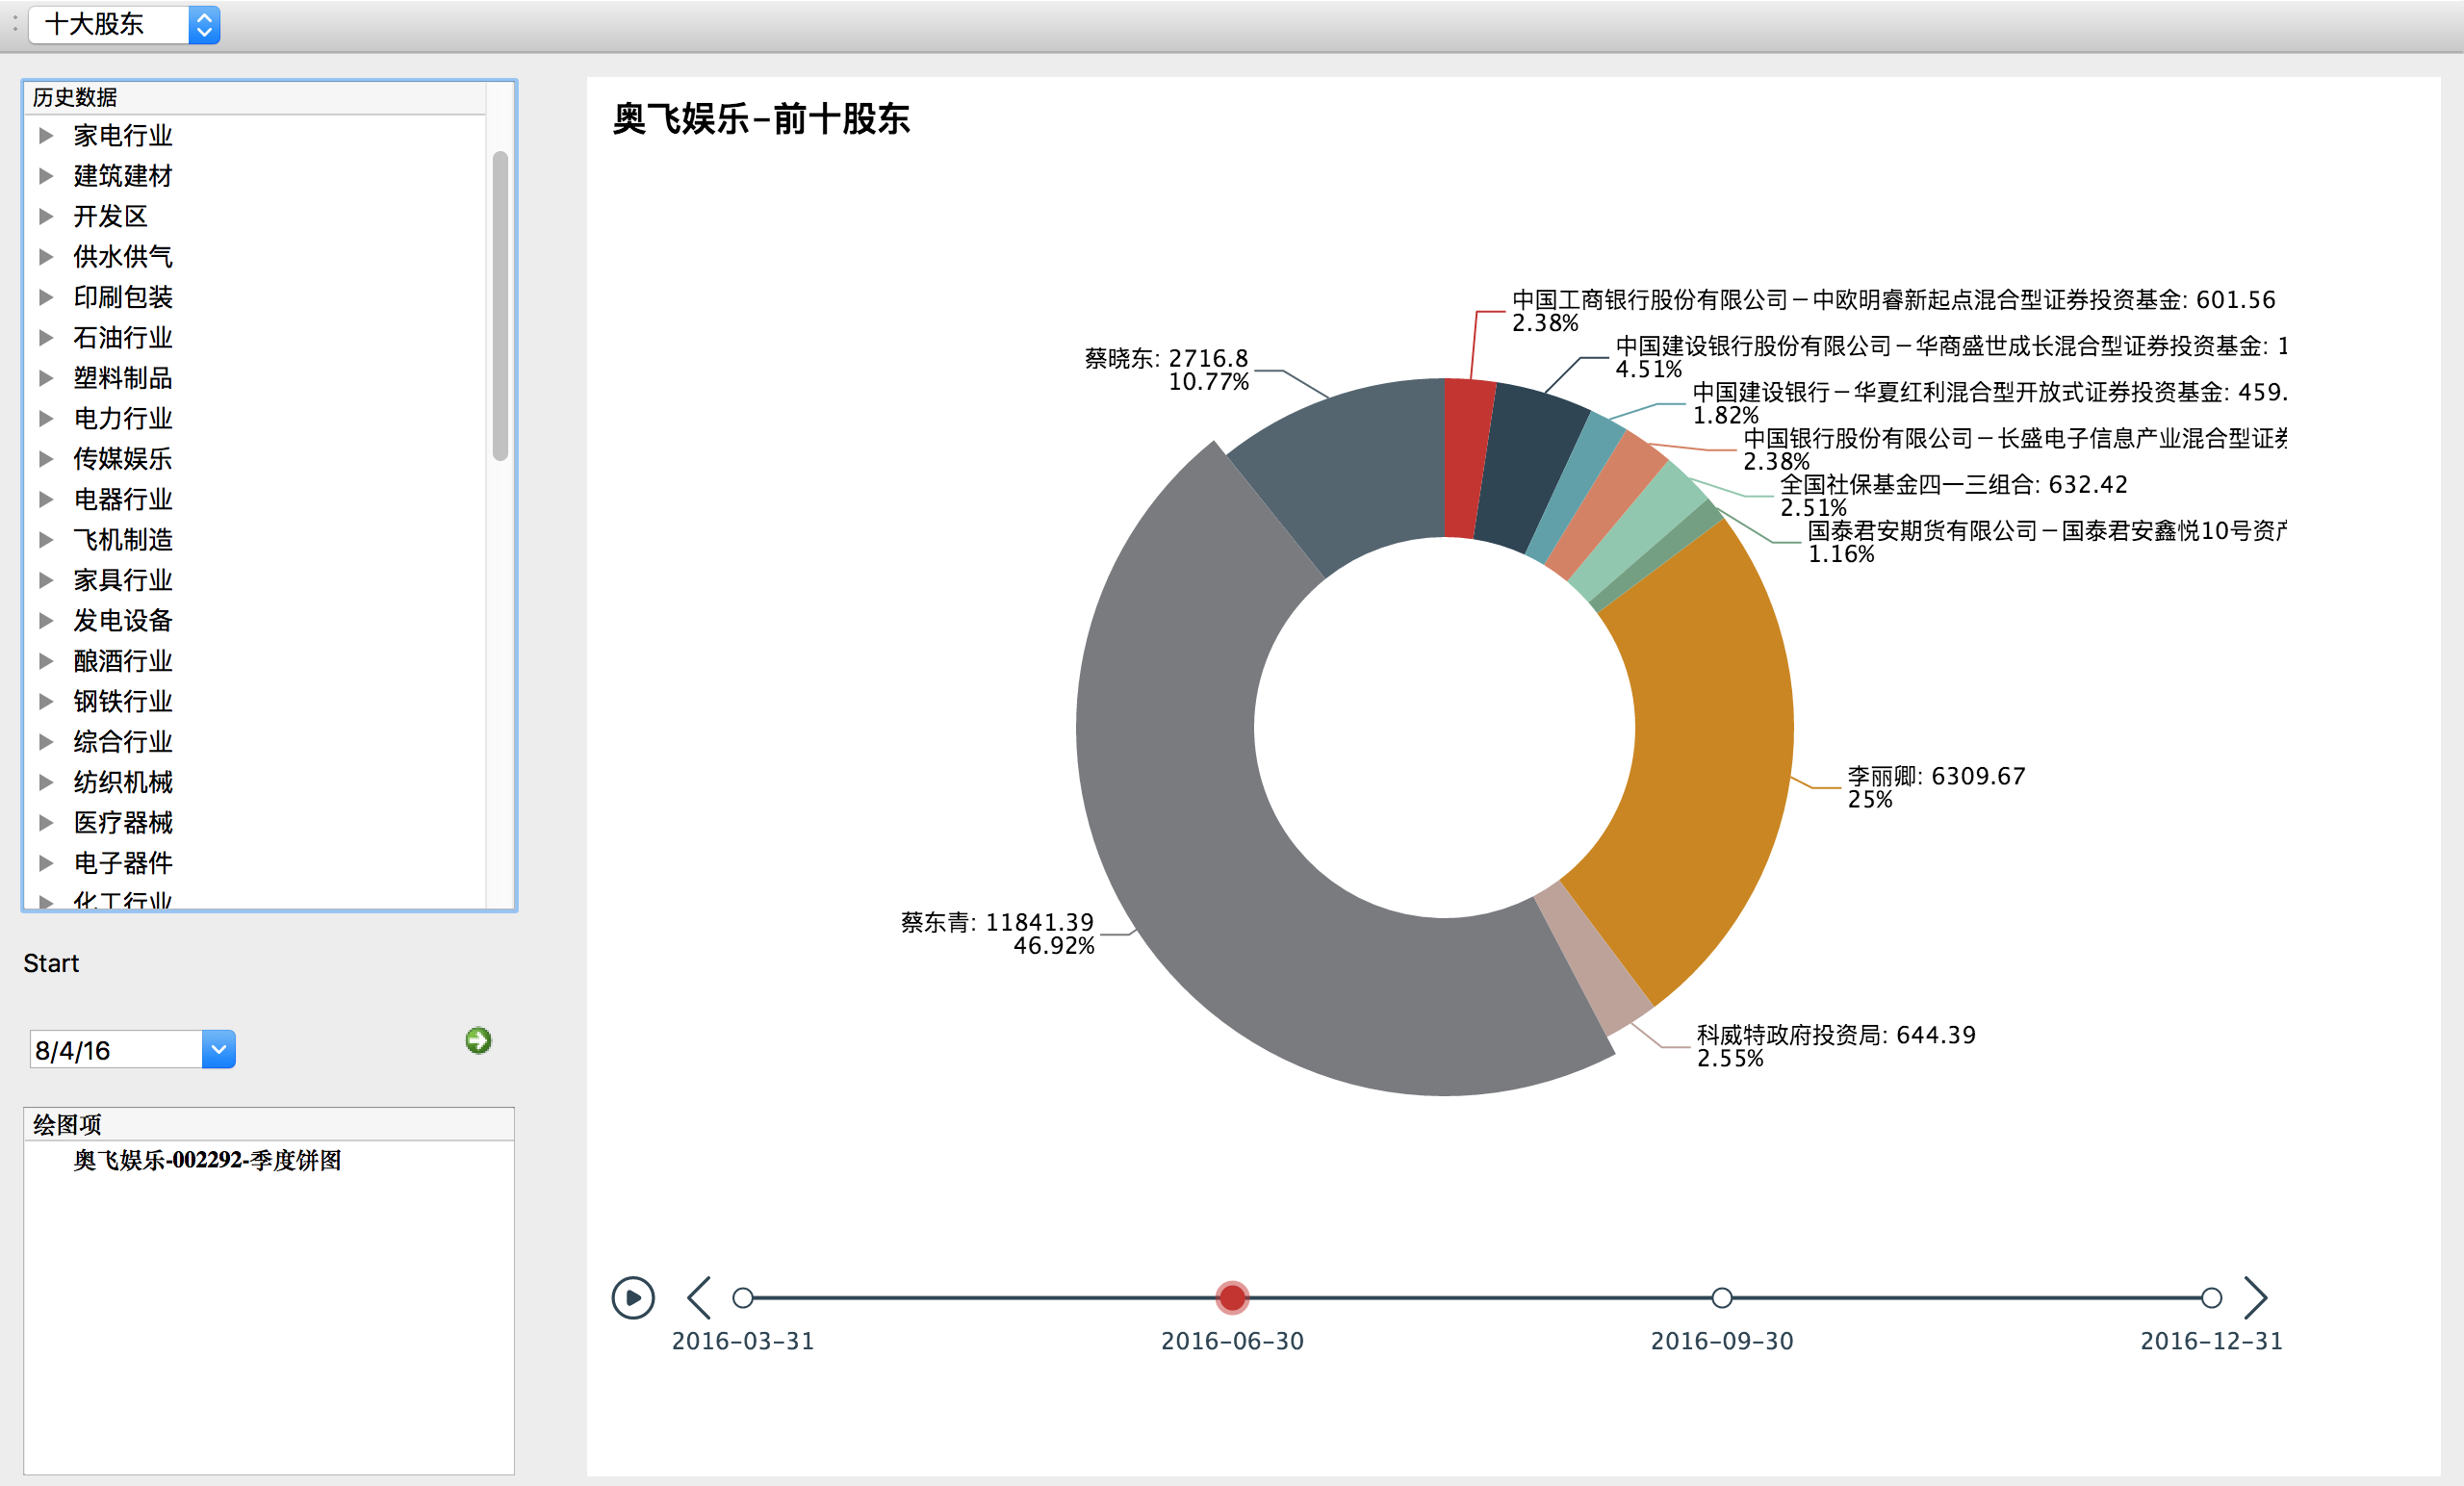
Tuchart will return data for top shareholders within your chosen year.
0.1.2.5
0.1.2.4
0.1.2.3
Email: rzli2@illinois.edu
此处可能存在不合适展示的内容,页面不予展示。您可通过相关编辑功能自查并修改。
如您确认内容无涉及 不当用语 / 纯广告导流 / 暴力 / 低俗色情 / 侵权 / 盗版 / 虚假 / 无价值内容或违法国家有关法律法规的内容,可点击提交进行申诉,我们将尽快为您处理。


